Continuous ECG Data Streaming
Combined workflow: Toolbox + NOA Python Client
Generate the FPGA design with NOA Toolbox, then run the Python scripts on your computer using noa-client. This example does not use the generated Simulink software interface or a target-side Jupyter notebook. Start with client installation and see acquisition and streaming for the host-side API.
Return to the shared examples catalogue to compare workflows.
Available at
It is located in the folder named ecg_data, and consists of three Simulink Model files, named ECG_stream2analog_1port_v2.slx, ECG_stream2analog_4ports_v2.slx and ECG_stream2analog_12ports_v2.slx, for a design able to transmit a complete signal from the host computer to analog ports through a Stream interface.
The first version is made to read a single signal, while the second one can read four signals at the same time, and the third twelve signals. The data used here comes from a matrix included in the folder as well, named A0001.mat, and containing ECG signals.
This example also relies on Python scripts, which are included in the folder as well under the names: pyscript_1channel.py, pyscript_4channels.py and pyscript_12channels.py
→ This example completes the previous one : ECG Data Streaming
Info
They were developped for the Eclipse Z7 board (except for the 12 ports version, which was made for the Noa Arch 1), but may be used on NOA Arch 1 as well.
Data
The data comes from PhysioNet, a platform for biomedical research, on which are published, among other ressources, biomedical data. The data used here contains 12-lead ECG signals, and was taken from a 2020 Cardiology challenge organised by the platform. More precisely, the matrix A0001.mat contains a 15 seconds signal, comes from the China Physiological Signal Challenge of 2018, and can be found on the page referenced above in the folder: training/cpsc_2018.
Another matrix named I0023.mat is also available in the folder. It comes from the St Petersburg INCART 12-lead Arrhythmia Database, can be found on the Physionet page in the folder training/st_petersburg_incart, and lasts 30 minutes. It can be interesting to use it with the models presented here, as they allow to transmit the full 30 minutes of the signal.
Structure of the data
Header files named A0001.hea and I0023.hea, are also included: they contain informations on the signals in the .mat files. It is structured in the following way.
For the A0001.hea file for example, from the first line, we see that the recording number is A0001, and the recording file is A0001.mat. The recording has 12 leads, each recorded at 500 Hz sample frequency, and contains 7500 samples.
From the next 12 lines, we see that each signal was written at 16 bits with an offset of 24 bits, 1000 units equal to 1 mV (so 1 unit equals to 1 µV), the resolution of the analog-to-digital converter (ADC) used to digitize the signal is 16 bits, and the baseline value corresponding to 0 physical units is 0. The first value of the signal, the checksum, and the lead name are included for each signal.
From the final 6 lines, we see that the patient is a 74-year-old male with a diagnosis (Dx) of 426783006. The medical prescription (Rx), history (Hx), and symptom or surgery (Sx) are unknown.
All of these informations can be found on the PhysioNet page linked above.
ECG Data Streaming 1 port version: ECG_stream2analog_1port_v2
This design is identical to the first version described in ECG Data Streaming, except for an additional output port, named nearly_empty and associated with an AXI4 Lite interface. Otherwise it still has two input ports, one to receive the data through a Stream interface and one to configure the sampling frequency of the output signal, and the two output ports on which the output ECG signal can be seen, one through an analog output and the other through a DAQ channel.
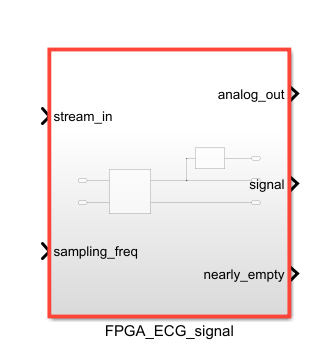
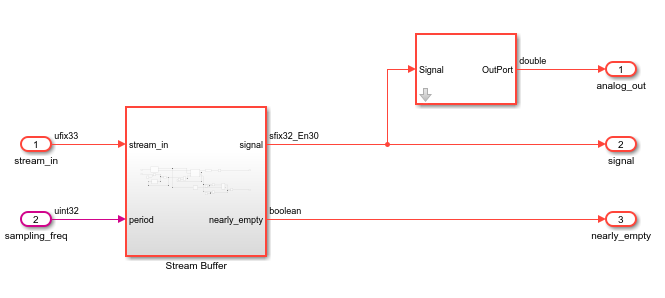
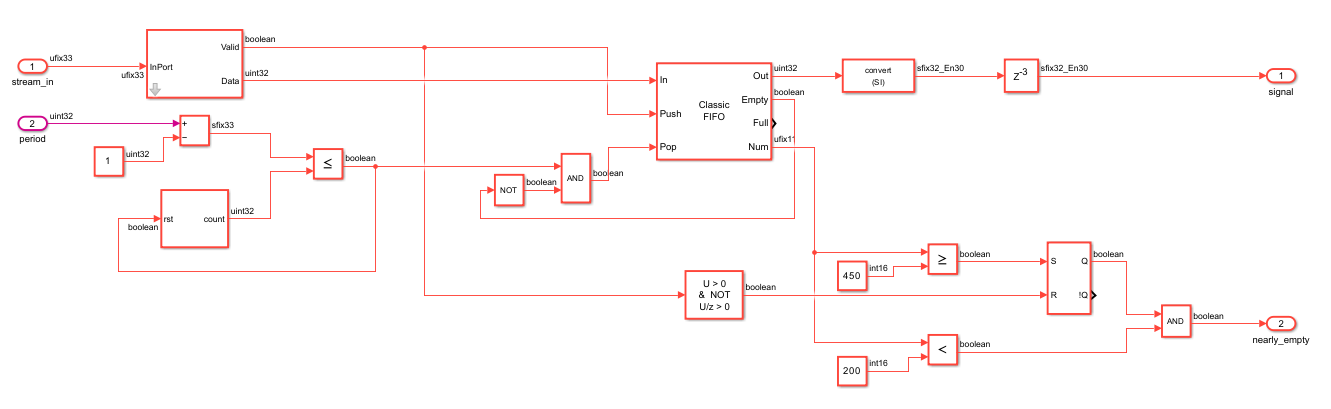
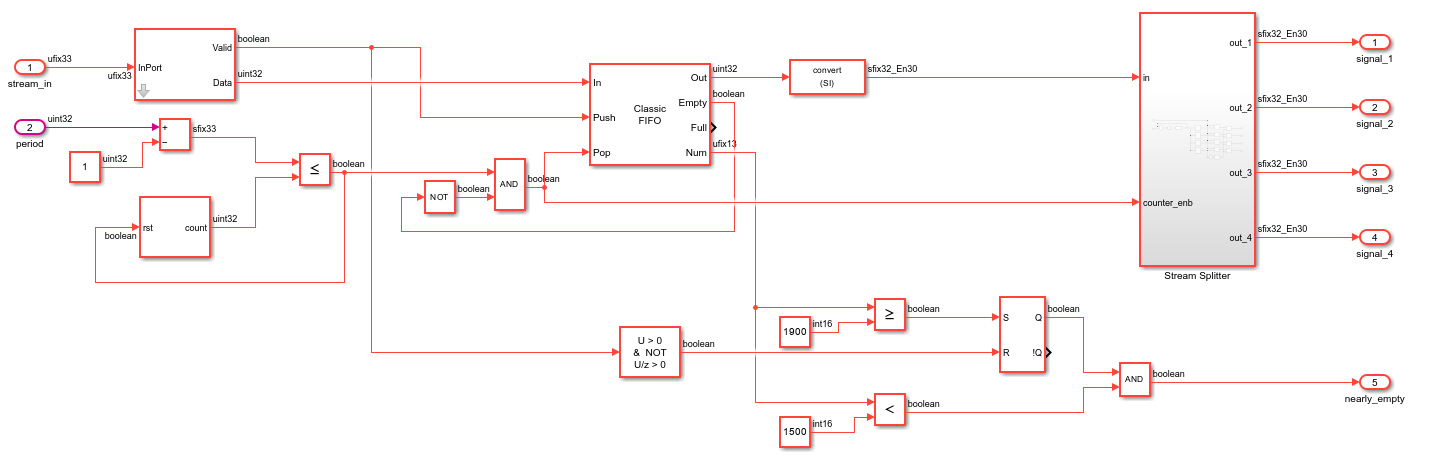
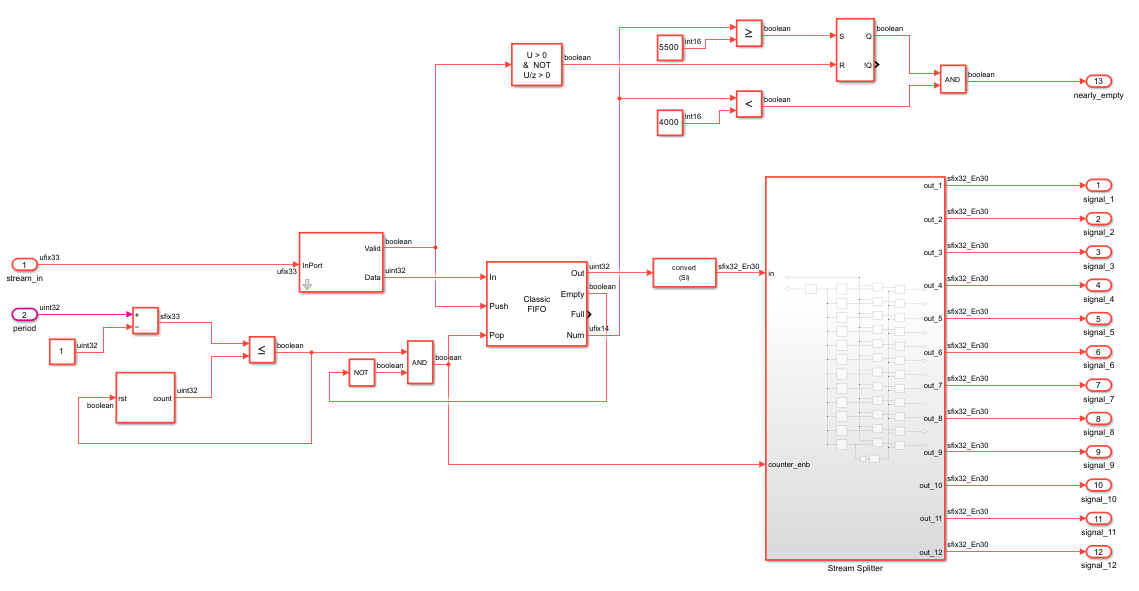
The nearly_empty port is associated to a signal that determines that the number of values contained in the FIFO is decreasing and soon reaching zero. This will be necessary when controlling the model: indeed, to be able to visualize the full signal without a FIFO taking a big space on the FPGA, we'll send the data block by block, and when one block is almost done being read, meaning the FIFO is almost empty, then the next one can be sent, until the complete signal has been transmitted.
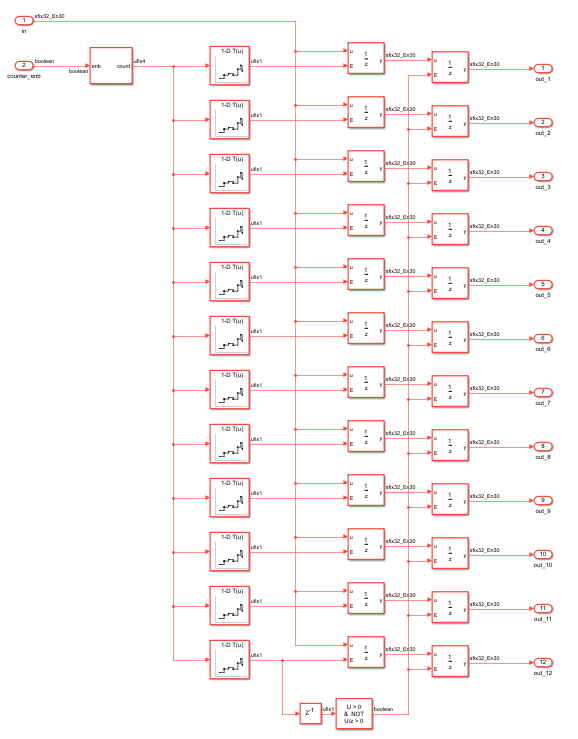
This works in the following way (see the "Stream Buffer" subsystem): on one hand the number of values in the FIFO is compared to a value of 450, to set a signal when it reaches it, and all the values of the data block have been stored in the FIFO, as later we'll send blocks of 500 values in the Stream interface. On the other hand the number of values in the FIFO is compared to a value of 200, to set another signal when it goes below this number. 200 was chosen to take into account the latency between the FPGA and the python interface.
When these two conditions are met, nearly_empty is raised to 1.
ECG Data Streaming 4 ports version: ECG_stream2analog_4ports_v2
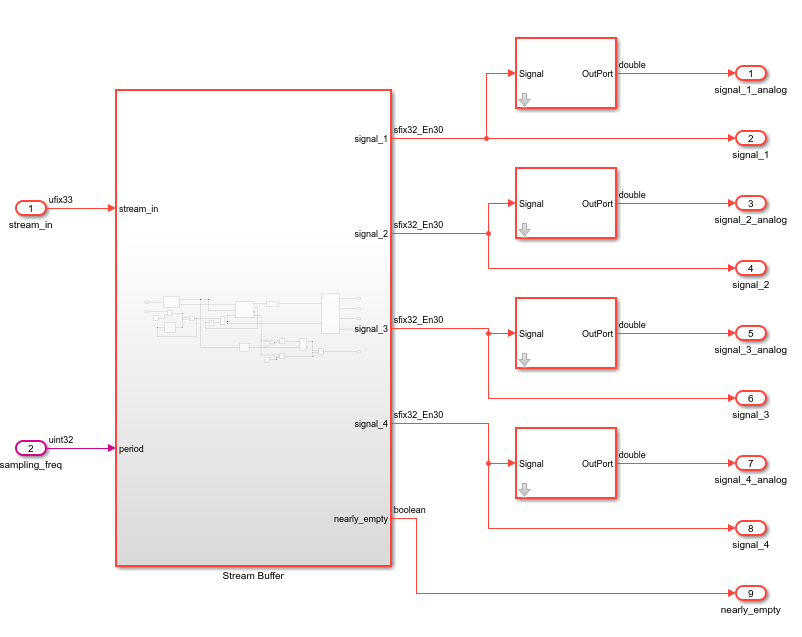
This design is identical to the first version described in ECG Data Streaming, except for an additional output port, named nearly_empty and associated with an AXI4 Lite interface. Otherwise it still has two input ports, one to receive the data through a Stream interface and one to configure the sampling frequency of the output signals, and the eight output ports on which the output signals can be seen, one through an analog output and the other through a DAQ channel for each of the four ECG leads.
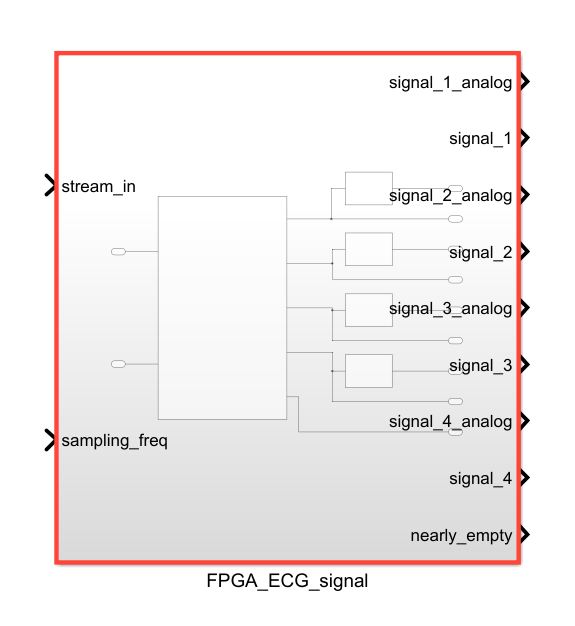
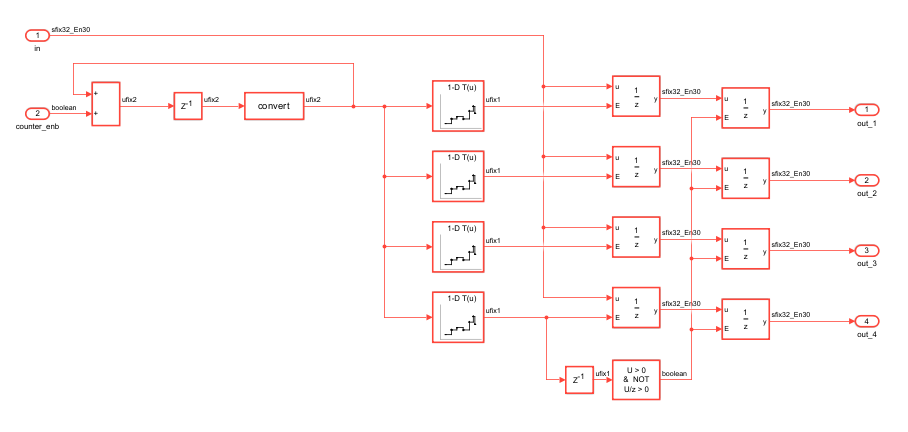
The nearly_empty port fulfills the same role as in the 1 port version described previously, and it works the same way. The only difference are the values the number of values in the FIFO is compared to, because the block of data received is four times bigger, as there are four signals and not just one.
ECG Data Streaming 12 ports version: ECG_stream2analog_12ports_v2
This design is identical to the first version described in ECG Data Streaming, except for an additional output port, named nearly_empty and associated with an AXI4 Lite interface. Otherwise it still has two input ports, one to receive the data through a Stream interface and one to configure the sampling frequency of the output signals, and the twenty-four output ports on which the output signals can be seen, one through an analog output and the other through a DAQ channel for each of the twelve ECG leads.
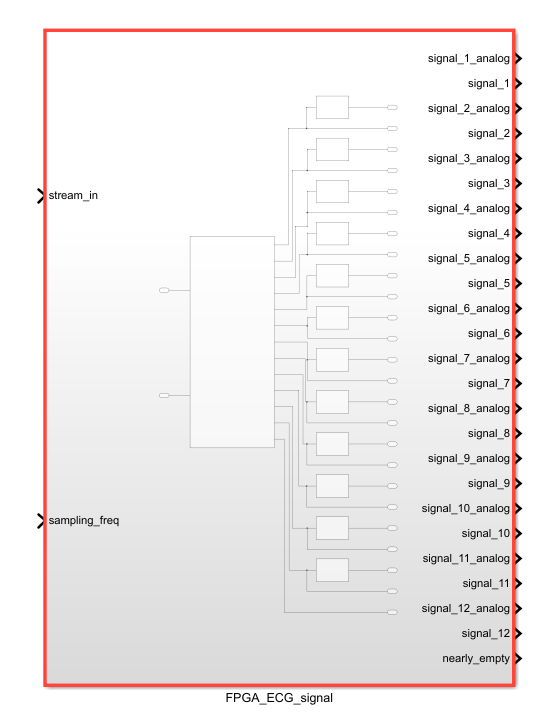
The nearly_empty port fulfills the same role as in the 1 port version described previously, and it works the same way. The only difference are the values the number of values in the FIFO is compared to, because the block of data received is twelve times bigger, as there are twelve signals and not just one.
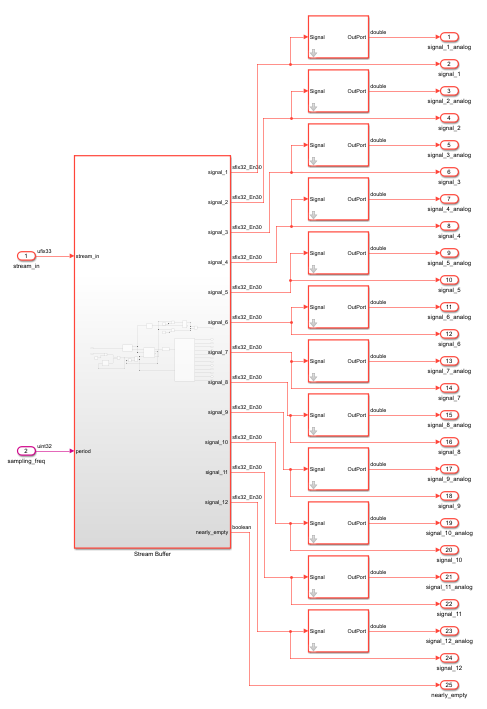
Ports
| Port | Direction | Interface Type | Description |
|---|---|---|---|
stream_in |
input | Stream Input | the signal received from the computer through a Stream (ufix33) |
sampling_freq |
input | AXI4-Lite | value of the sampling frequency of the output signal; default is 500Hz (uint32) |
analog_out |
output | Analog Output 0 | the output ECG signal, redirected to an analog port (sfix32_En31) |
signal |
output | DAQ Channel 0 | the output ECG signal, redirected to the host computer (sfix32_En30) |
nearly_empty |
output | AXI4-Lite | the signal indicating that the FIFO is nearly empty (boolean) |
| Port | Direction | Interface Type | Description |
|---|---|---|---|
stream_in |
input | Stream Input | the signal received from the computer through a Stream (ufix33) |
sampling_freq |
input | AXI4-Lite | value of the sampling frequency of the output signal; default is 500Hz (uint32) |
signal_1_analog |
output | Analog Output 0 | the first output ECG signal, redirected to an analog port (sfix32_En31) |
signal_1 |
output | DAQ Channel 0 | the first output ECG signal, redirected to the host computer (sfix32_En30) |
signal_2_analog |
output | Analog Output 1 | the second output ECG signal, redirected to an analog port (sfix32_En31) |
signal_2 |
output | DAQ Channel 1 | the second output ECG signal, redirected to the host computer (sfix32_En30) |
signal_3_analog |
output | Analog Output 2 | the third output ECG signal, redirected to an analog port (sfix32_En31) |
signal_3 |
output | DAQ Channel 2 | the third output ECG signal, redirected to the host computer (sfix32_En30) |
signal_4_analog |
output | Analog Output 3 | the fourth output ECG signal, redirected to an analog port(sfix32_En31) |
signal_4 |
output | DAQ Channel 3 | the fourth output ECG signal, redirected to the host computer (sfix32_En30) |
nearly_empty |
output | AXI4-Lite | the signal indicating that the FIFO is nearly empty (boolean) |
| Port | Direction | Interface Type | Description |
|---|---|---|---|
stream_in |
input | Stream Input | the signal received from the computer through a Stream (ufix33) |
sampling_freq |
input | AXI4-Lite | value of the sampling frequency of the output signal; default is 500Hz (uint32) |
signal_1_analog |
output | Analog Output 0 | the first output ECG signal, redirected to an analog port (sfix32_En31) |
signal_1 |
output | DAQ Channel 0 | the first output ECG signal, redirected to the host computer (sfix32_En30) |
signal_2_analog |
output | Analog Output 1 | the second output ECG signal, redirected to an analog port (sfix32_En31) |
signal_2 |
output | DAQ Channel 1 | the second output ECG signal, redirected to the host computer (sfix32_En30) |
signal_3_analog |
output | Analog Output 2 | the third output ECG signal, redirected to an analog port (sfix32_En31) |
signal_3 |
output | DAQ Channel 2 | the third output ECG signal, redirected to the host computer (sfix32_En30) |
signal_4_analog |
output | Analog Output 3 | the fourth output ECG signal, redirected to an analog port(sfix32_En31) |
signal_4 |
output | DAQ Channel 3 | the fourth output ECG signal, redirected to the host computer (sfix32_En30) |
signal_5_analog |
output | Analog Output 4 | the fifth output ECG signal, redirected to an analog port (sfix32_En31) |
signal_5 |
output | DAQ Channel 4 | the fifth output ECG signal, redirected to the host computer (sfix32_En30) |
signal_6_analog |
output | Analog Output 5 | the sixth output ECG signal, redirected to an analog port (sfix32_En31) |
signal_6 |
output | DAQ Channel 5 | the sixth output ECG signal, redirected to the host computer (sfix32_En30) |
signal_7_analog |
output | Analog Output 6 | the seventh output ECG signal, redirected to an analog port (sfix32_En31) |
signal_7 |
output | DAQ Channel 6 | the seventh output ECG signal, redirected to the host computer (sfix32_En30) |
signal_8_analog |
output | Analog Output 7 | the eighth output ECG signal, redirected to an analog port(sfix32_En31) |
signal_8 |
output | DAQ Channel 7 | the eighth output ECG signal, redirected to the host computer (sfix32_En30) |
signal_9_analog |
output | Analog Output 8 | the ninth output ECG signal, redirected to an analog port (sfix32_En31) |
signal_9 |
output | DAQ Channel 8 | the ninth output ECG signal, redirected to the host computer (sfix32_En30) |
signal_10_analog |
output | Analog Output 9 | the tenth output ECG signal, redirected to an analog port (sfix32_En31) |
signal_10 |
output | DAQ Channel 9 | the tenth output ECG signal, redirected to the host computer (sfix32_En30) |
signal_11_analog |
output | Analog Output 10 | the eleventh output ECG signal, redirected to an analog port (sfix32_En31) |
signal_11 |
output | DAQ Channel 10 | the eleventh output ECG signal, redirected to the host computer (sfix32_En30) |
signal_12_analog |
output | Analog Output 11 | the twelfth output ECG signal, redirected to an analog port(sfix32_En31) |
signal_12 |
output | DAQ Channel 11 | the twelfth output ECG signal, redirected to the host computer (sfix32_En30) |
nearly_empty |
output | AXI4-Lite | the signal indicating that the FIFO is nearly empty (boolean) |
Controling the model through the Python API
First, in the Matlab command window write period = num, where num is the working period corresponding the frequency set later in step 1.4 of the Generation of the Bitstream file process. The blocks in the design work at the period named "period", so it is necessary, to have the design work at the proper frequency.
Then you'll need to follow the steps in the Generation of the Bitstream file page, to generate the bitstream and hardware files. It is not necessary to generate the Simulink interface in step 4.2, we won't be using it this time.
Once this is done, you'll need the .bit and .hwh files in the generated Vivado project folder: you can place them in the folders named fpga_files_1channel, fpga_files_4channels and fpga_files_12channels respectively (or you can also change the path indicated in the scripts).
Unlike the previous examples, we'll use Python scripts to control the model, instead of a Simulink interface. These scripts use the NOA python client, so make sure you have it installed in your environnement, as well as the other required libraries.
Open the scripts in your prefered code editor. You'll need to configurate a few things, by following the following instructions: the hardware's address, the chosen date file and the normalization coefficient, the sampling frequency and the target frequency.
Note
The scripts for the 1-port and 4-ports versions were written for the Eclipse z7 board. If you want to run them on the Arch 1, you'll need to enable and setup the analog ports, like in the 12-ports version script.
-
Enter your hardware's address line 92, for example:
addr = "192.168.2.99" -
Make sure line 93 and 94 the path to the .bit and .hwh is the right one.
-
Then line 11, make sure the name of the file to load corresponds to the one you want (default is A0001.mat):
file = scipy.io.loadmat('A0001.mat') -
Adjust the normalization coefficient line 15 to the chosen data: it must be equal or greater to the biggest value in the dataset.
-
Enter your target device's frequency line 69 (default is 40MHz):
fpga_freq = int(40000000) -
Enter the sampling frequency for the output signal line 70 (default is 500Hz):
sampling_freq = 500 -
When everything is configured, and your target device is connected to your computer, you can run the Python script.
-
Below is what you should see on an oscilloscope connected to the analog output.
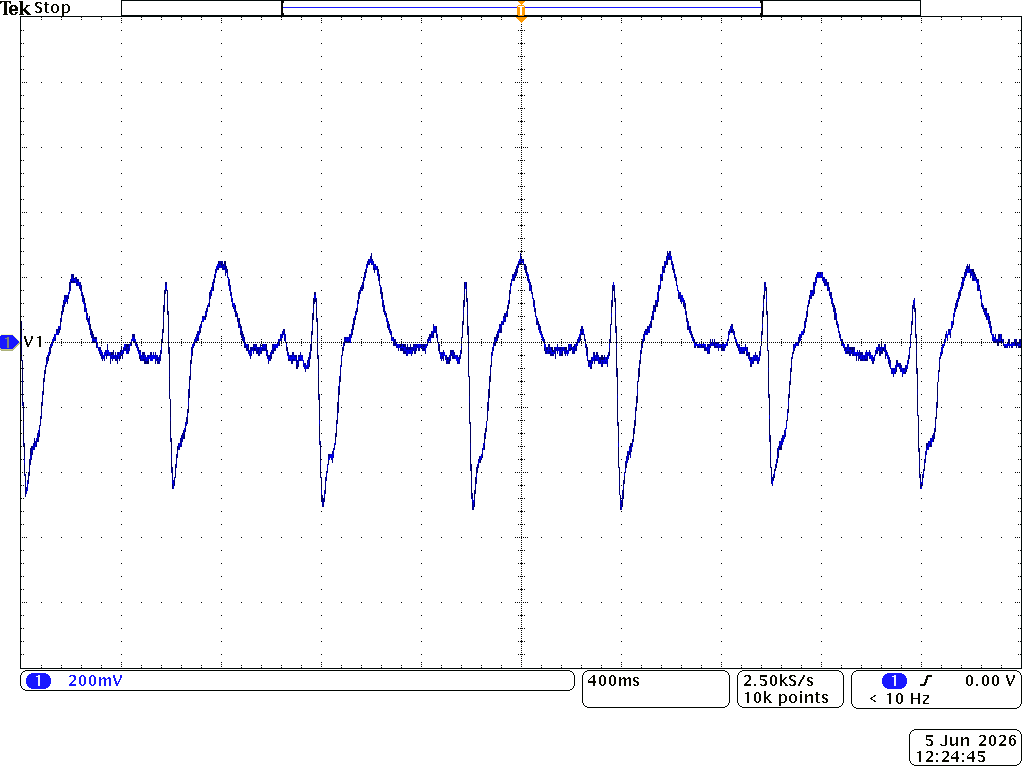
This is the signal that can be seen on the first analog port.
-
Enter your hardware's address line 97, for example:
addr = "192.168.2.99" -
Make sure line 98 and 99 the path to the .bit and .hwh is the right one.
-
Then line 11, make sure the name of the file to load corresponds to the one you want (default is A0001.mat):
file = scipy.io.loadmat('A0001.mat') -
Adjust the normalization coefficient line 15 to the chosen data: it must be equal or greater to the biggest value in the dataset.
-
Enter your target device's frequency line 73 (default is 40MHz):
fpga_freq = int(40000000) -
Enter the sampling frequency for the output signal line 74 (default is 500Hz):
sampling_freq = 500 -
When everything is configured, and your target device is connected to your computer, you can run the Python script.
-
Below is what you should see on an oscilloscope connected to the analog output.
These are the four signals that can be seen on the first, second, third and fourth analog ports, from top to bottom.
-
Enter your hardware's address line 112, for example:
addr = "192.168.2.99" -
Make sure line 113 and 114 the path to the .bit and .hwh is the right one.
-
Then line 11, make sure the name of the file to load corresponds to the one you want (default is A0001.mat):
file = scipy.io.loadmat('A0001.mat') -
Adjust the normalization coefficient line 15 to the chosen data: it must be equal or greater to the biggest value in the dataset.
-
Enter your target device's frequency line 85 (default is 40MHz):
fpga_freq = int(40000000) -
Enter the sampling frequency for the output signal line 86 (default is 500Hz):
sampling_freq = 500 -
When everything is configured, and your target device is connected to your computer, you can run the Python script.
-
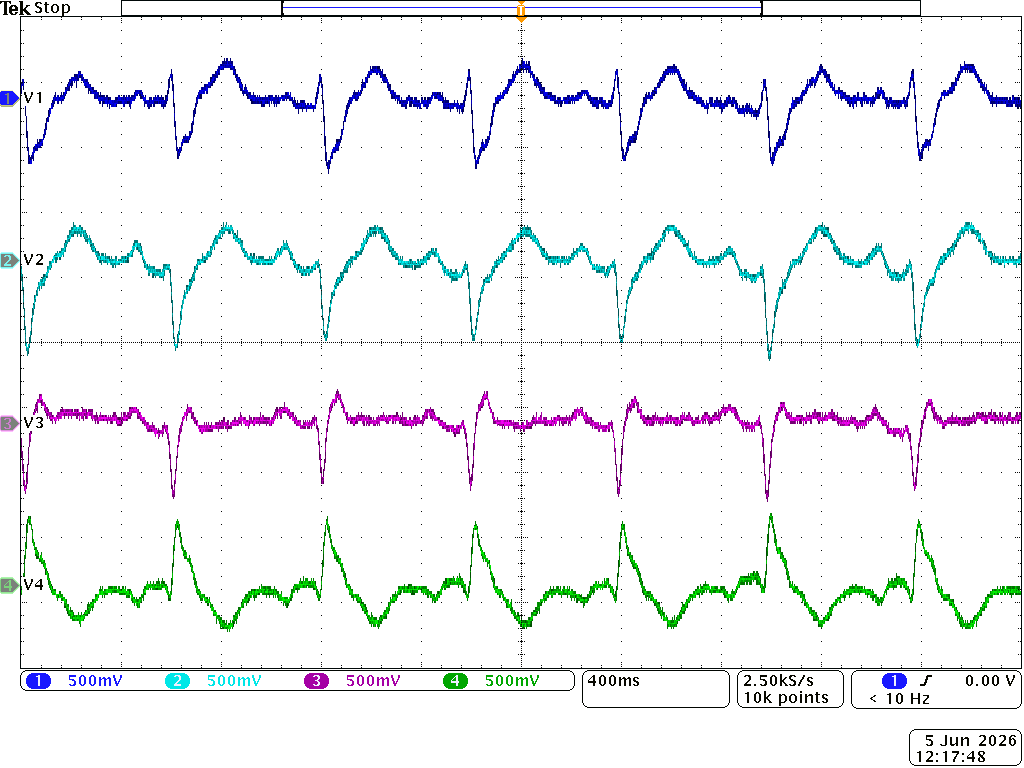
Below is what you should see on an oscilloscope connected to the analog output.
These are the first four signals that can be seen on the first, second, third and fourth analog ports, from top to bottom.
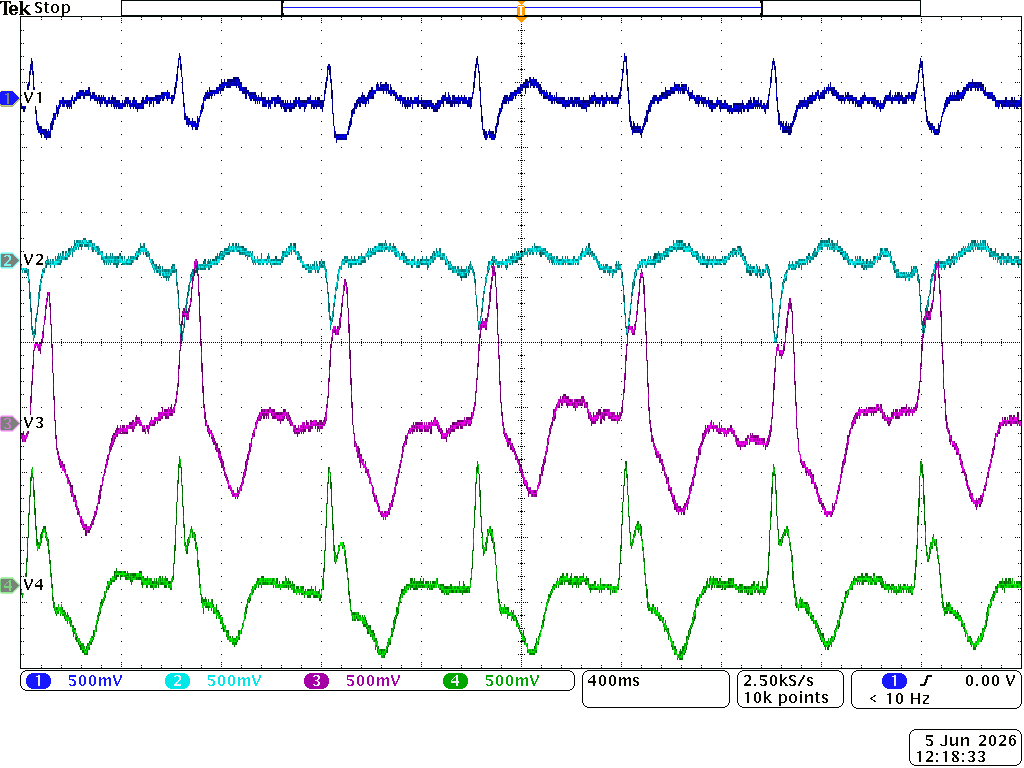
These are the next four signals that can be seen on the fifth, sixth, seventh an eighth analog ports, from top to bottom.
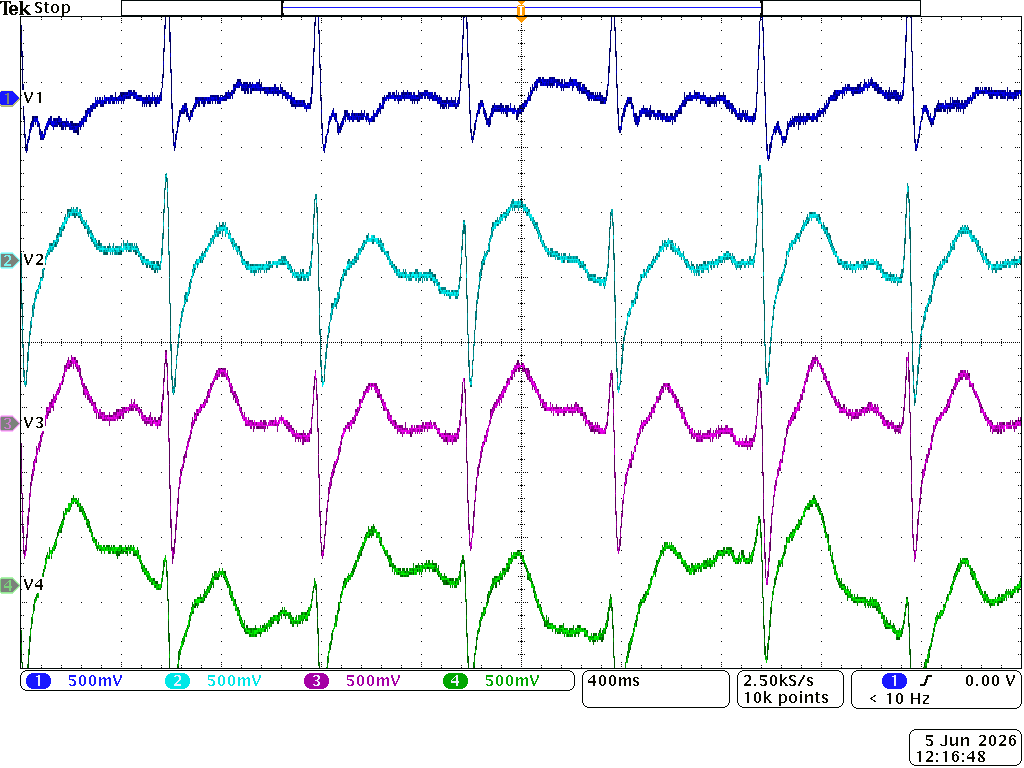
These are the last four signals that can be seen on the ninth, tenth, eleventh an twelfth analog ports, from top to bottom.